About Geoscientist Artificial Intelligent

Qualitative Interpretation
Qualitative Interpretation is the foundational process of understanding the geological framework and structural geometry of a sub-surface area. Unlike Quantitative Interpretation (QI), which focuses on rock properties, Qualitative Interpretation focuses on "Where is the structure?" and "What is the geological story?". Here is the step-by-step breakdown of activities in Qualitative Interpretation:
About Geoscientist Artificial Intelligent

Phase 1: Data Loading & Quality Control (QC)
This phase is critical because the entire interpretation depends on the integrity of the input; any error here will propagate through the entire project, leading to the "Garbage In, Garbage Out" scenario. The primary objective of this stage is to build a consistent, clean, and georeferenced database where seismic and well data are synchronized in the same spatial and temporal environment.
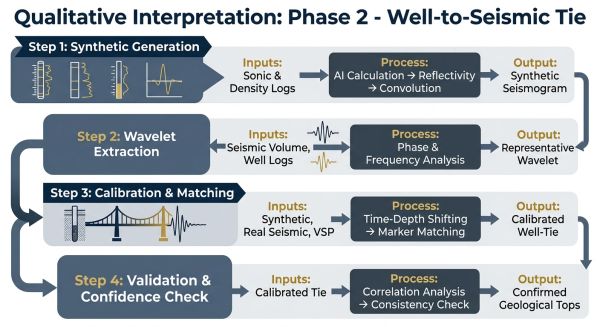
Phase 2: Well-to-Seismic Tie
The Well-to-Seismic Tie is one of the most critical steps in the entire interpretation workflow. It is the "bridge" that connects the high-resolution vertical data from a borehole (measured in depth) to the lower-resolution spatial data from seismic surveys (measured in two-way travel time - TWT). Without an accurate tie, any subsequent geological mapping is essentially guesswork. The primary goal of this phase is to establish a precise relationship between the depth of geological markers (tops) and their corresponding seismic reflectors, allowing the interpreter to say: "This specific peak in the seismic data is exactly the top of the reservoir."
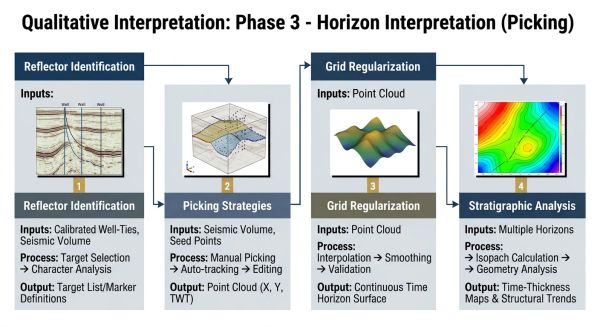
Phase 3: Horizon Interpretation (Picking)
Horizon Interpretation (Picking) is the core activity of the qualitative workflow. While the Well-to-Seismic Tie told us which reflector to look for, Horizon Interpretation is the process of mapping that reflector across the entire survey area to define the 3D geometry of the geological layers. The primary objective of this phase is to transform a set of discrete seismic reflections into continuous geological surfaces (horizons), creating the structural "skeleton" of the subsurface model.
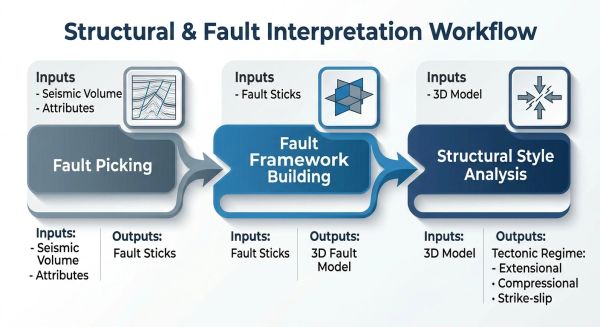
Phase 4: Structural & Fault Interpretation
The structural interpretation process begins with the systematic mapping of faults and discontinuities, utilizing seismic attributes such as Coherence, Variance, and Curvature to ensure the precise capture of fault geometry and dip across the seismic volume. These findings are then integrated into a 3D structural framework to evaluate reservoir compartmentalization, determining whether faults act as seals or conduits a critical factor for calculating Original Oil In Place (OOIP) and designing drainage strategies. This workflow concludes with a comprehensive tectonic characterization to identify the dominant deformation regime (extensional, compressional, or strike-slip), providing essential insights into paleostress orientations and the distribution of sub-seismic fracture networks required for accurate reservoir simulation.
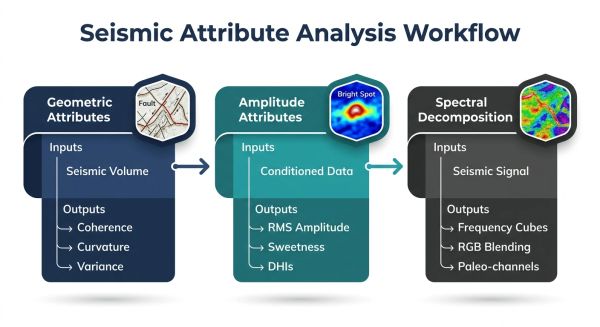
Phase 5: Seismic Attribute Analysis
To enhance reservoir characterization, a multi-attribute analysis is performed, beginning with geometric attributes—such as Coherence, Variance, and Curvature to quantify lateral discontinuities and map the fine-scale structural skeleton of the reservoir. Complementing this, amplitude-based attributes, including RMS and Sweetness, are utilized to identify Direct Hydrocarbon Indicators (DHIs) and discriminate prospective reservoir facies from non-productive geology. Finally, spectral decomposition is applied via CWT or S-Transforms to resolve thin-bed deposits and visualize stratigraphic features like paleo-channels and fan systems, providing a high-resolution understanding of the depositional environment and stratigraphic traps.
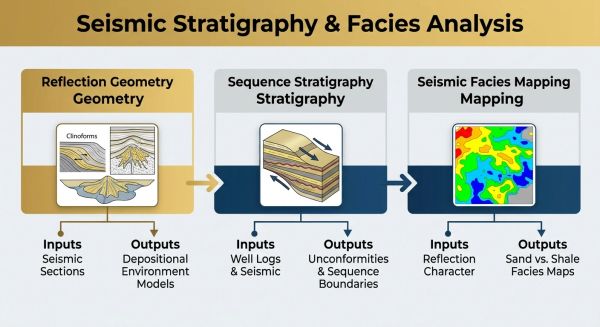
Phase 6: Seismic Stratigraphy & Facies Analysis
The interpretation process begins with a qualitative analysis of reflection geometries and terminations such as onlaps and clinoforms to infer the depositional environments and spatial evolution of the reservoir. These observations are then integrated into a chronostratigraphic framework using sequence stratigraphic principles to identify key markers, such as unconformities and maximum flooding surfaces, which define the timing of reservoir deposition and seal formation. Finally, this framework is utilized for seismic facies mapping, where the correlation of seismic characters with well-log data allows for the prediction of lateral lithology distributions, effectively bridging the gap between qualitative seismic interpretation and quantitative reservoir modeling.
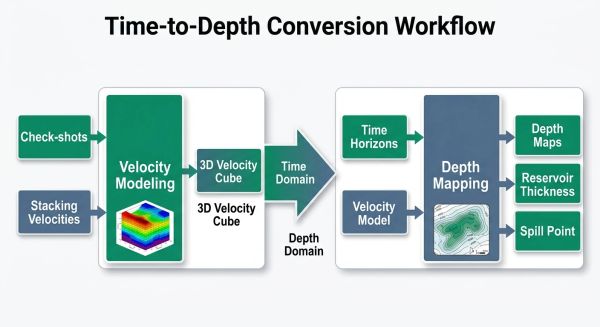
Phase 7: Time-to-Depth Conversion
To ensure structural integrity, seismic data recorded in Two-Way Time (TWT) is converted to depth using a calibrated velocity model that integrates high-resolution VSPs, well check-shots, and regional stacking velocities. By accounting for lateral and vertical variations caused by lithology and compaction, this process ensures a geologically consistent time-to-depth transformation. The resulting depth maps are then utilized to calculate True Vertical Thickness (TVT) for accurate volumetric analysis, identify structural spill points to determine maximum hydrocarbon column heights, and provide precise depth targets for optimized well planning and risk mitigation.
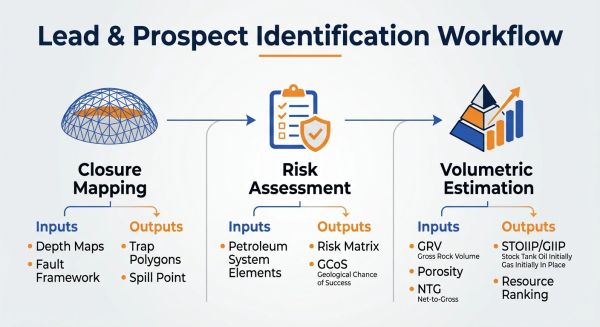
Phase 8: Lead & Prospect Identification
The final phase focuses on prospect identification and resource appraisal, beginning with the delineation of structural and stratigraphic traps by mapping the crest and spill points to define their areal extent and vertical closure. These identified leads are then subjected to a rigorous Geological Chance of Success (GCoS) evaluation, analyzing the five critical petroleum system elements source, migration, reservoir, and seal integrity to prioritize targets and mitigate drilling risk. This workflow culminates in preliminary volumetric calculations to derive the Gross Rock Volume (GRV), utilizing both deterministic and stochastic methods, such as Monte Carlo simulations, to provide a range of potential resource estimates (Low, Best, and High) as the primary foundation for investment decisions.