Neutron technology
Introduction
A neutron log is a fundamental well-logging tool used in petroleum engineering to measure the porosity of rock formations (phi). It works by bombarding the formation with neutrons and measuring the hydrogen concentration, which is directly related to the amount of fluid-filled pore space.
📜Basic Principle: The "Hydrogen Index"
The neutron tool works by emitting high-energy (fast) neutrons into the formation. These neutrons collide with the nuclei of the atoms in the rock.
The Physics: The core principle is based on hydrogen. Neutron logs use a source to emit fast neutrons. As these neutrons collide with atoms in the formation, they lose energy, slowing down the most when they hit hydrogen atoms, which have a similar mass.
The Measurement: Detectors on the tool measure the number of slowed- down (thermal) neutrons. A low count rate indicates many hydrogen atoms, meaning high porosity (lots of fluid-filled space). Conversely, a high count rate indicates low porosity. Common neutron sources include chemical ones like Americium-241/Beryllium (AmBe), or, in more advanced tools, an electronic neutron generator.
⚙️ Key Applications
Neutron logs are a versatile technology used throughout a well's life.
Porosity Determination:
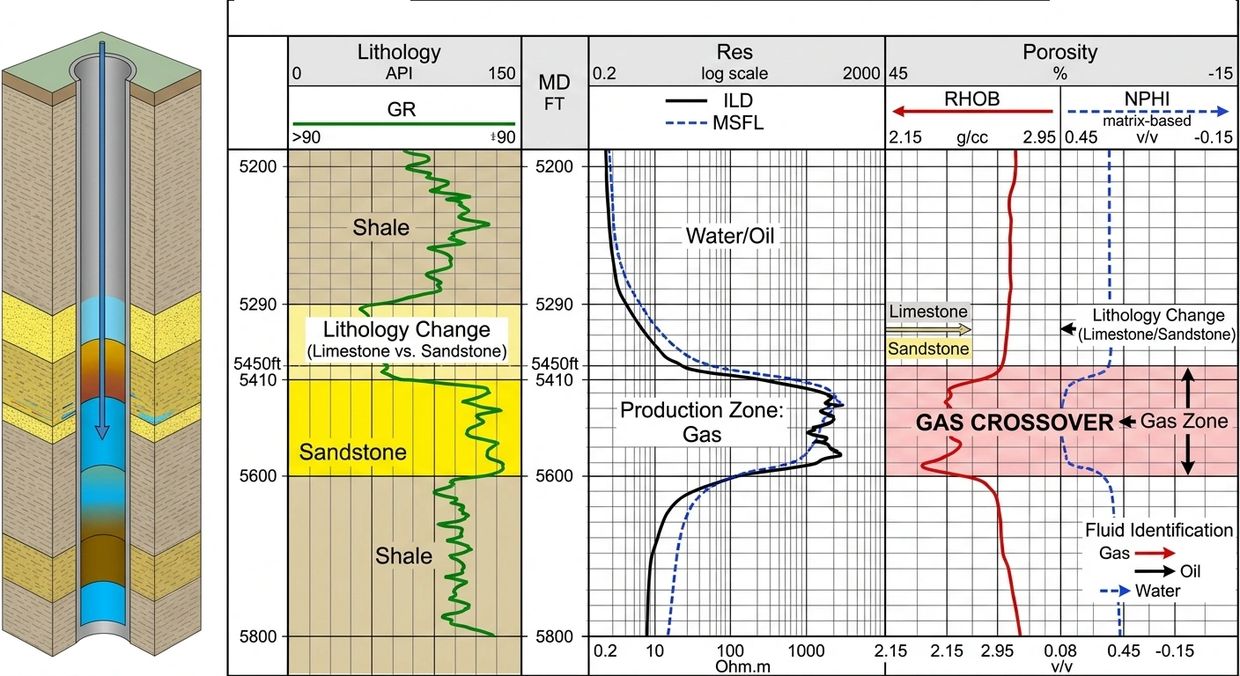
This is the primary use. The neutron log is often combined with a density log. The overlay of these two curves is a powerful diagnostic tool used to identify lithology (rock type) and shale content, and to get a more accurate estimate of porosity.
Fluid Identification (Gas Detection): This is its most famous use. Because gas has a much lower hydrogen density than oil or water, the Neutron Log will show an abnormally low porosity in gas zones.
Lithology Identification: By comparing the Neutron Log with the Density Log (RHOB), engineers can identify whether the rock is Sandstone, Limestone, or Dolomite.
Shale Content: Shales contain "bound water" in their clay structure. The Neutron Log sees this hydrogen and reports a very high (false) porosity, which helps identify clay-rich zones. so a gamma-ray log is always needed to identify shales and avoid misinterpretation.

⚠️Limitations and Factors Affecting the Log
Salinity: High salinity water has fewer hydrogen atoms than fresh water, which can slightly affect the reading.
Temperature & Pressure: High-pressure gas can increase hydrogen density, making the "gas effect" less obvious.
Borehole Condition: If the borehole is "washed out" (too large), the tool might measure the drilling mud instead of the formation, leading to inaccurate data.
Shaliness: As mentioned, clays have high hydrogen content due to chemical structure, leading to an overestimation of effective porosity.
In modern practice, the Neutron Log is rarely used alone. It is the "partnership" between the Neutron and Densitylogs that provides the most accurate calculation of true porosity and fluid type.
Pulsed Neutron Logging
introduction
Pulsed Neutron Logging is an advanced and increasingly important application. Unlike standard neutron tools, a pulsed neutron generator can be turned on and off, emitting neutrons in bursts. This allows it to work through steel casing and cement, making it invaluable for evaluating formations long after a well has been cased and completed. Pulsed neutron logs have two primary operating modes:
Sigma (σ) Mode: Measures the thermal neutron capture cross-section of the formation. Since chlorine (in saline formation water) has a high "sigma," this mode is excellent for determining water saturation in formations where the water is salty. It can also be used to detect gas and estimate gas pressure.
Carbon/Oxygen (C/O) Mode: This mode uses gamma-ray spectroscopy to directly measure the ratio of carbon to oxygen atoms. This is a critical advantage in environments where water salinity is unknown or variable, as it can distinguish oil from water independently of salt content.
Neutron-Induced Gamma Ray Tomography
This is a leading-edge development. Some advanced tools, like the Neutron Gamma Density (NGD) , scan the formation azimuthally.
- Principle: A focused beam of neutrons is pulsed, and the gamma rays resulting from inelastic scatter are measured by multiple detectors facing different sides of the tool. A rotating shutter or a multi-detector array creates a directional measurement.
- The Advancement: The result is a density image of the formation behind casing.
This allows to:
- Identify thin beds and fractures not seen by standard, non-imaging logs.
- Evaluate cement quality and casing standoff by looking for variations in the image.
- Detect vuggy porosity (isolated pores in carbonate rocks).
- Determine formation dip in a cased hole.

Multi-Detector Pulsed Neutron Logging
Modern tools use at least two detectors (near and far) to measure the neutron population over time.
- Epithermal Neutrons (The Fast Phase): Measured immediately after the burst. These neutrons are still slowing down and are very sensitive to hydrogen density (porosity). This is the modern equivalent of the traditional porosity measurement, but it's less affected by formation salinity because the neutrons haven't been captured yet.
- Thermal Neutrons (The Capture Phase): Measured after the neutrons have slowed down (a few hundred microseconds later). These thermal neutrons are captured by atomic nuclei, and the rate of this capture is primarily controlled by the thermal neutron capture cross-section, called Sigma (Σ) .
Modern pulsed neutron services also offer additional capabilities:
- Water Flow Logging (WFL): Identifies water movement and entry points behind the casing, which is crucial for diagnosing water production problems in mature fields.
- Gravel Pack Evaluation: Can assess the integrity of sand-control completions by analyzing the activation of elements like silicon, helping operators identify if a gravel pack has deteriorated.
- Geochemical Analysis: Some tools measure natural spectral gamma rays (Potassium, Uranium, Thorium) to enable detailed clay typing and provide a more complete geochemical picture of the reservoir.
- Identifying Bypassed Pay: One of the most valuable uses of pulsed neutron logs is finding oil or gas zones that were missed during initial drilling. This is essential for planning workovers and extending the economic life of mature fields.
- Monitoring Reservoir Changes Over Time: By running pulsed neutron logs at different times (time-lapse monitoring), engineers can track how fluid saturations change as the reservoir is produced, observing the movement of contacts between oil, water, and gas. This data is key for making informed reservoir management decisions.
density Logging

introduction
The Neutron Log is one of the most vital "porosity logs" in petroleum engineering and petrophysics. It is a nuclear log that measures the ability of a formation to attenuate (slow down) neutrons. A density log is a type of porosity log that continuously measures the bulk density of the formation (rock + fluid) surrounding a borehole. It operates by emitting gamma rays from a radioactive source into the formation.
Basic Principle (Gamma-Ray Attenuation)
- A chemical source (e.g., Cesium-137) emits medium-energy gamma rays.
- Gamma rays collide with electrons in the formation (Compton scattering).
- The loss of energy (attenuation) is primarily a function of the electron density of the formation.
Electron density is directly proportional to bulk density (ρb).
Primary Uses in Petroleum Engineering
Porosity Calculation
This is the most important use. Since the tool measures total bulk density, porosity is derived using the formula:
ϕ=(ρma−ρb/(ρma−ρf)
Where
ϕ is Porosity, ρma is Matrix density (e.g., 2.65 g/cc for quartz sandstone, 2.71 g/cc for limestone), ρb is Bulk density from the log and ρf isFluid density in pores (e.g., ~1.0 g/cc for fresh mud filtrate, ~1.1 g/cc for salt water).The tool records:
Bulk Density (ρb) The total density of the formation (rock matrix + pore fluids).
Density Correction (Δρ) –An indicator of borehole rugosity or bad wall contact. If Δρ is large, the reading is unreliable.
Photoelectric Factor (PEF)
introduction
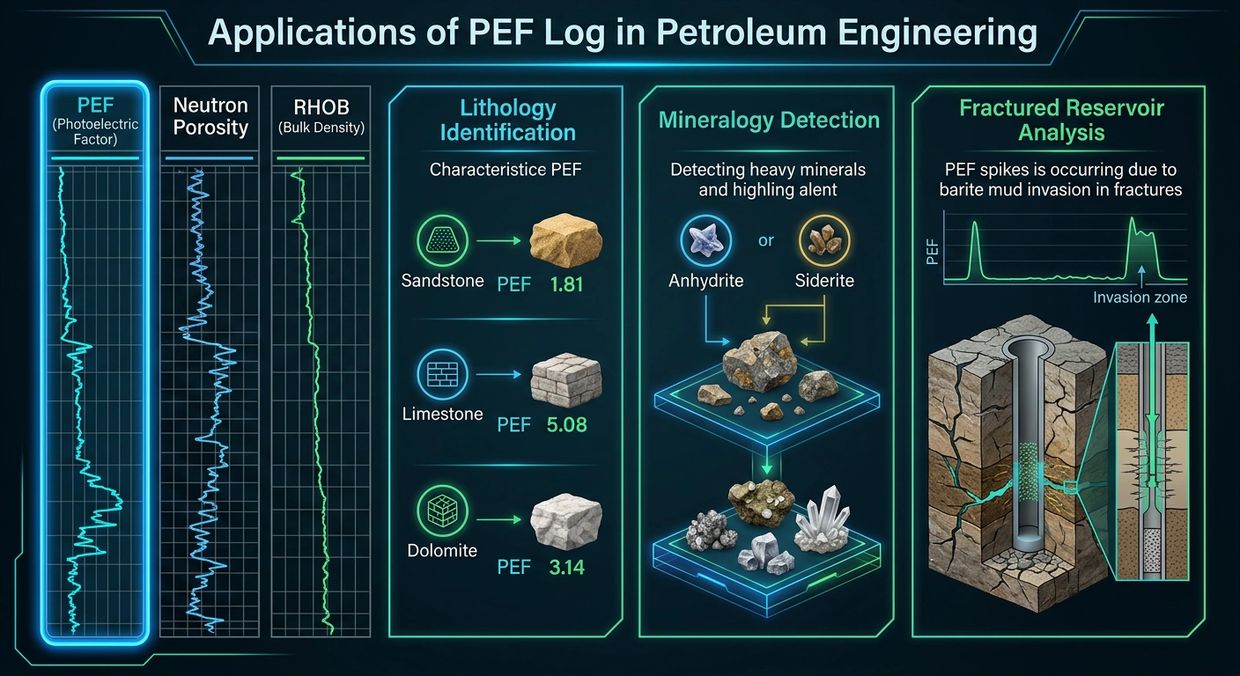
Density tools measured at lower gamma-ray energies, this helps identify lithology (e. g., sandstone vs. limestone vs. dolomite).
The Photoelectric Factor (PEF) log is an essential tool in formation evaluation, primarily used to determine the mineralogy or lithology of reservoir rocks. It is often referred to as the "lithology log" because it is largely unaffected by porosity or the fluids within the rock, making it very effective at distinguishing between different matrix types. Here is a detailed breakdown of the PEF log, from its fundamental physics to its practical applications.
In petroleum engineering, you will most frequently use the PEF log in conjunction with the Neutron-Density crossplot to resolve lithology ambiguities.
- If the Neutron-Density separation suggests a lithology, the PEF confirms it.
- To identify a pay zone: First, use the PEF to confirm the rock is a porous sandstone (Pe ~1.8) or a dolomite (Pe ~3.1). Then, use resistivity logs to calculate water saturation.
- To spot a warning sign: A PEF reading that is too high for the suspected lithology suggests the presence of heavy minerals, a barite mudcake, or a complex mineralogy that standard porosity models cannot handle.
Physical Principle: The Photoelectric Effect
The PEF measurement is typically recorded simultaneously with the density log. A tool equipped with a gamma-ray source is pressed against the borehole wall. It measures the rate of absorption of low-energy gamma rays (usually in the 40-80 keV range) by the formation.
The mechanism: When a gamma ray collides with an electron in the rock's atoms, it can be completely absorbed (the photoelectric effect). The probability of this absorption is highly dependent on the atomic number (Z) of the elements in the formation.
The measurement (PEF): The log records the photoelectric absorption factor, Pe. This value is mathematically related to the average atomic number by the formula: Pe = (Z/10)^3.6. It is typically expressed in barns/electron.
Fluids are "invisible": Formation fluids (oil, gas, water) are composed of elements with very low atomic numbers (primarily Hydrogen, Carbon, Oxygen). Consequently, they have a negligible effect on the PEF reading. This is why the log truly reflects the rock matrix and not what is inside the pores.
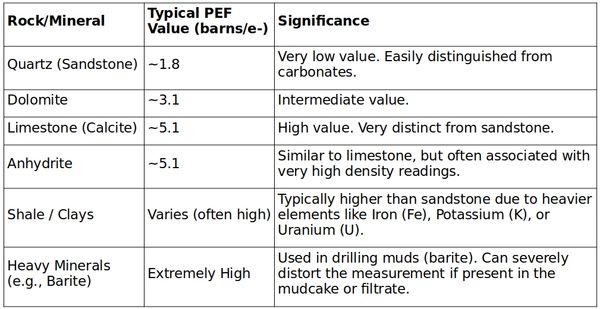
Key Values for Common Minerals
Because PEF is a function of atomic number, specific rock types have distinct, predictable values. This is the key to its usefulness.
Practical Applications
The primary use of the PEF log is lithology determination, which is critical for calculating porosity and water saturation accurately.
Differentiating Sandstone from Carbonate: This is the most common application. In a mixed clastic-carbonate environment, the gamma ray log might be unreliable (e.g., radioactive sandstones or clean carbonates). The PEF log clearly delineates the low-PEF sandstone from the high-PEF limestone.
Identifying Complex Lithologies: The PEF is crucial for identifying evaporites (like anhydrite) or specific mineral cements within a reservoir. For example, calcite cement in a sandstone will raise the PEF above the expected value of ~1.8, alerting the analyst to the presence of a mineral that reduces porosity.
Limitations and Corrections (Crucial for Analysts)
While powerful, the PEF log has specific limitations you must be aware of to avoid misinterpretation.
Shallow Depth of Investigation: The measurement only penetrates about one inch into the formation. This means it primarily reads the flushed zone (the area invaded by mud filtrate).
Borehole Effects: The measurement can be ruined by poor contact with the borehole wall. Key issues include:
Mudcake: Heavy minerals like barite in the mudcake have an extremely high PEF, which will dominate the reading and make the formation appear as a false limestone or dolomite.
Standoff: If the tool is not pressed firmly against the wall, the drilling fluid in the gap absorbs gamma rays. This generally leads to a lower recorded PEF and requires a correction.
Hole Size: In large-diameter holes, the fluid lens between the pad and the formation also suppresses the PEF reading.
Relation to Density: While PEF is lithology, it is often converted to a volumetric cross-section (U, in barns/cm³) by multiplying it by bulk density (RHOB): U = Pe * RHOB. This value is sometimes used in complex mineralogy solvers.